Facts & Figures

Facts & Figures

The Car Wash Industry
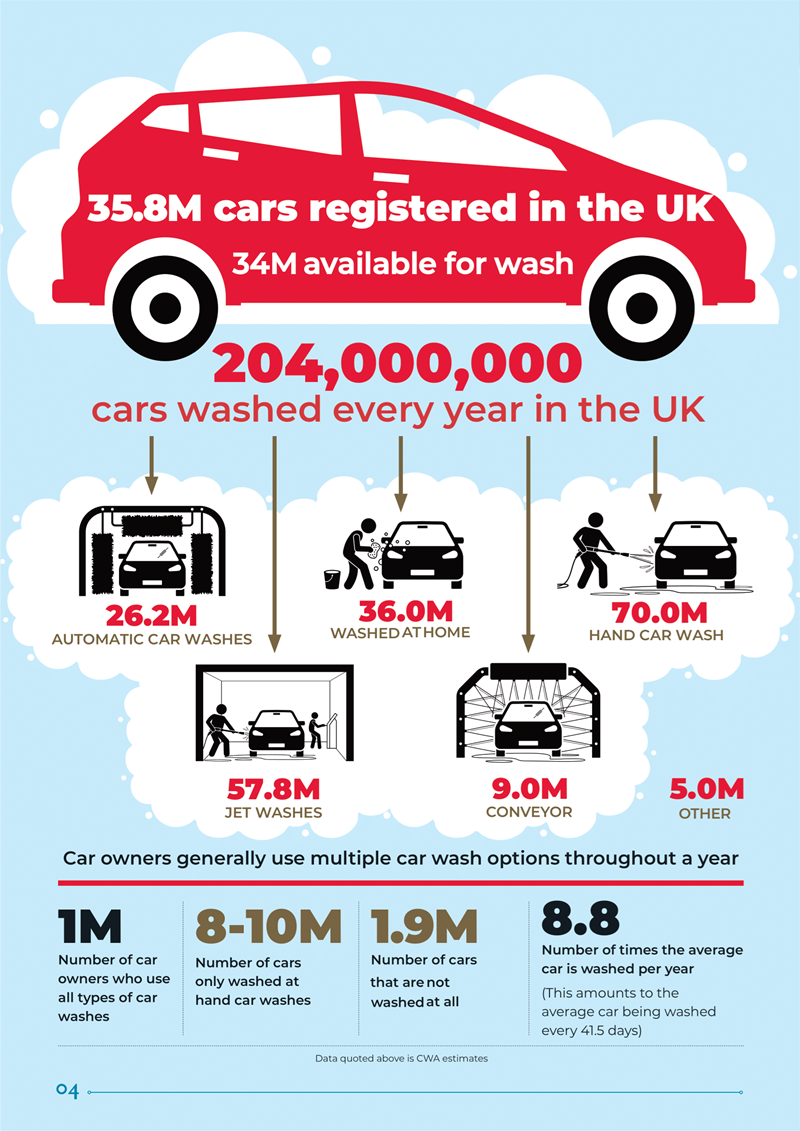
There are currently 32.7 million passenger cars in the UK (source DfT). Washing these  generates in excess of £1.0bln in sales. For more information, please scroll down and download Car Washes in numbers.


Market Data


Key takeaways

·        Data for automated washes supplied by Experian Catalist

·        Estimation of the number of HCWs supplied by Nottingham Trent University


In terms of the total number of washing facilities by type the market is still dominated by HCWs, whose numbers however have fallen from 7,500 in 2021 to around 6,000. For Automated Wash types we are seeing forecourt operators investing in new equipment and replacing old equipment and Jet Washes with some standalone multi-bay Jet Wash sites now also coming to the market.

There is still thought to be a diminishing percentage of car washing at home - however the numbers are difficult to estimate.

Key takeaways

·        HCW numbers fallen by 20% since 2019.

·        Revenues up by 40%

·        Revenue growth driven by a massive 140% increase in prices.


This chart has been updated to show the 2023 figures and represents annual revenues by wash type, showing the income generated by each sector of the industry.

The car wash market (excluding DIY) is still dominated by the HCW sector with nearly 90% of the market compared to 80% in 2021. When increased revenues generated from the interior cleaning and valeting business are combined with the revenues from exterior washing and higher prices, the HCW sector is estimated to turnover around £1.8 billion per year - the same as 2021, despite the overall number of sites having fallen since the pandemic.


Source: CWA Research